I am tring to make my own clutter height map for ATOLL, for Brussel region.
I found online some free Lidar pointcloud file, I have imported it in Global Mapper v21 and I have discovered how to export the scan in .BIL format, as an elevation grid format.
The exported file is recognised by ATOLL, it gives me the suggestion to put it in the clutter height file but the data in it it is not what I need. PLease check the atatchments.
Using the link, you can download the Clutter Heights map of buildings only. Brussel region.7z
As an instruction, I used the video on the link. Only instead of a relief I put a checkbox on the building https://youtu.be/yfvaIeMx7cw Also, in order for everything to be correct in the calculations, you need to subtract 56m (the minimum value from the height of each building)
I've had trouble getting good results for "height above ground" for point clouds where there are large building footprints and/or lots of building points and few ground points. Ive yet to find a method that results in a good interpolation to fill the gaps
This point cloud is no exception.
I'm not sure the output of clutter heights for building is as accurate as it could be.
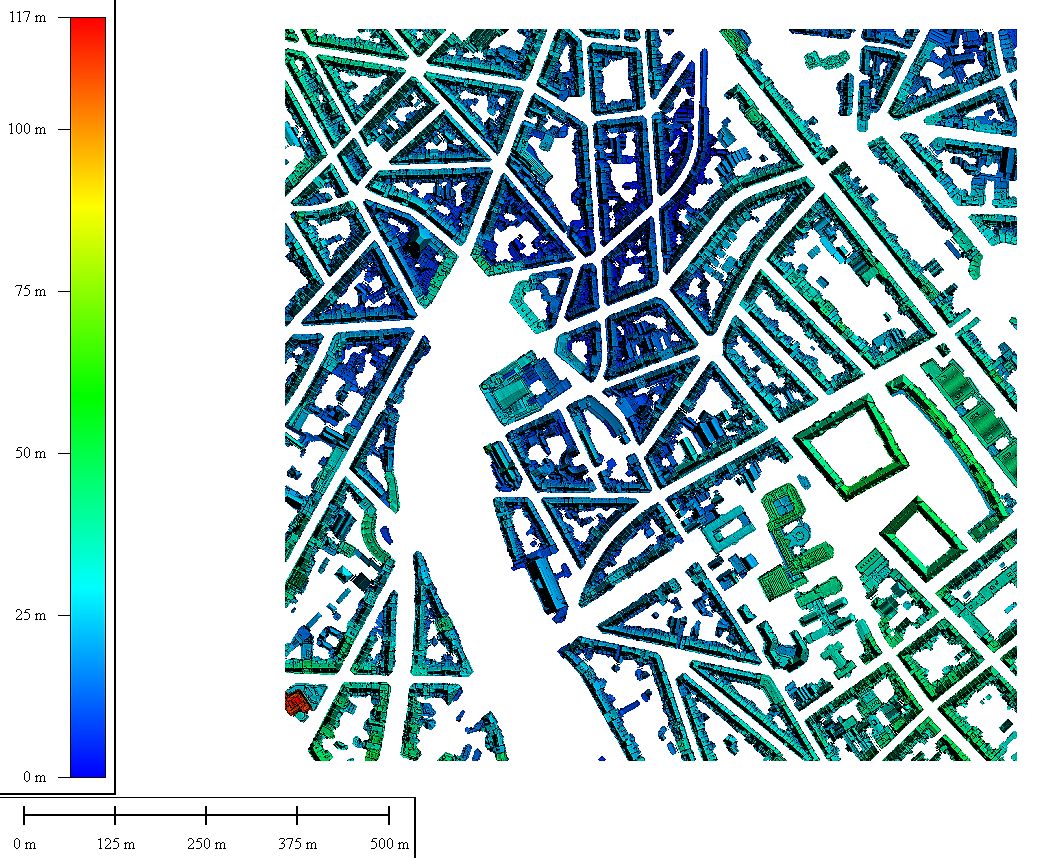
At the bottom left of the point cloud is a tall building with a crane on top. Points for the crane are unclassified.
For checking, filter the point cloud with classification of ground and building only. Draw a polygon around a section of the building and roadway to capture ground and building points, then gather statistics for the selected points.
Minimum Z for ground in the polygon is 75.73m and maximum Z is 82.44m
Minimum Z for building in the polygon is 77.67m and maximum Z is 173.56m
Maximum potential building height could be up to (building maximum Z - ground minimum Z) = 97.83m.
Moving the mouse around the building shows ground points are at about 82m and moving the mouse around the inside of the building shows maximum elevations around 173m. Quick and dirty calculation of 173 - 82 = 91m is approx height of the building. Plus and minus a few meters.
Maximum height of any point in the "Brussel region_1m_UTM_31N" grid file is 116.952m which is the tall building in the bottom left corner. That's a big difference.
The closest I can get for THIS POINT CLOUD is to use grid creation tool with grid type = height above ground, grid method = binning minimum value DTM, filter for buildings only, manual grid = 1m, grid no data distance = 0 Grid File
Hope someone can pitch in with a process that gives decent accuracy.
Originally Posted by dmitry28
Using the link, you can download the Clutter Heights map of buildings only. Brussel region.7z
As an instruction, I used the video on the link. Only instead of a relief I put a checkbox on the building https://youtu.be/yfvaIeMx7cw Also, in order for everything to be correct in the calculations, you need to subtract 56m (the minimum value from the height of each building)
Last edited by phila63; 2024-02-10 at 12:18 PMReason: add file
i tried to create a vector file using qgis. i could not succeed in using the file with crosswave propagation model. Any help suggestion in this regard pl.
i tried to keep the main columns Name/Type/AGL/Polygon_Type .
While importing in atoll x and y values are being considered and all the polygons are not properly marked.
Last edited by radio_network; 2024-04-12 at 02:06 AM

 Thanks:


 Reply With Quote


")

Bookmarks